
Image: Extinction Rebellion activists looking to the skies for salvation from climate change Armageddon
Across the world, politicians are going out of their way to promise fantastically expensive climate policies. US President Joe Biden has promised to spend $US500bn ($648bn) each year on climate — about 13 per cent of the entire federal revenue. The EU will spend 25 per cent of its budget on climate.
Most rich countries, stampeded by climate activists and shonky science now promise to go carbon neutral by mid-century.
Surprisingly very few countries have made a serious independent estimate of the cost.
In a study I have made, I estimate the total cost to Australia of achieving net-zero carbon dioxide emissions by 2050 to be $1.13 trillion.
Yet politicians focus on ever stronger climate policies that lower and potentially eradicate growth over the coming decades.
 Moreover, these policies have little impact. If all the rich countries in the world were to cut their carbon emissions to zero tomorrow and for the rest of the century, the lack of energy would devastate societies. Yet, run on the standard UN climate model, the effort would make an almost unnoticeable reduction in temperatures of 0.4C by 2100.
This is because more than three-quarters of the global emissions in the rest of this century will come from Asia, Africa and Latin America. These nations are determined to lift their populations out of poverty and ensure broad development using plentiful energy, mostly from cheap fossil fuels.
China remains committed to supporting its coal industry while the rest of the world experiences a decline, and is now home to half of the world’s coal capacity. In 2019, China was the biggest emitter of fossil fuel carbon dioxide (CO2) emissions. With a share of almost 30 percent of the world’s total CO2 emissions that year, this was roughly twice the amount emitted by the second largest emitter the United States.
Let’s review one of the IPCC’s models of climate change against actual observations. The IPCC has produced many computer models of predicted global warming. The model in red in the chart below is the type of model that gets the likes of Greta Thunberg, Sir Richard Attenborough, Al Gore and Prince Charles in a lather, and motivates schoolgirls to sob and cry during Extinction Rebellion demonstrations.
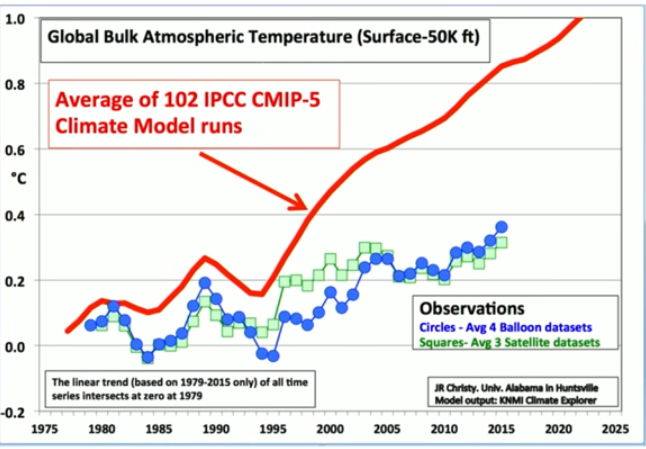 But hang on, as you can see from actual observations of the weather balloon readings and satellite readings on the same chart, the IPCC model is wildly inaccurate and grossly overstated. It seems to matter little. Thunberg, Attenborough, Gore and the Prince are on a crusade. After noticing the IPCC models do not accord with reality, the crusaders changed the name of their crusade from global warming to the more nebulous Climate Change.
To understand the concept we need to look at some physics, starting with the NASA chart, Earth’s Energy Budget.
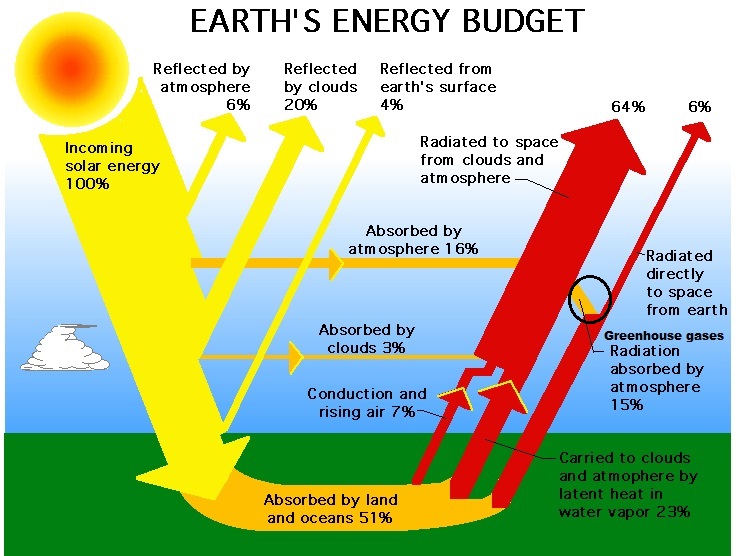 The sun’s rays, depicted in yellow, are in the visible spectrum, hit the earth, warming it. Some of this warmth, depicted in red, is re-radiated in the infra-red spectrum, carrying away heat.
If it wasn’t for the so-called greenhouse gases, principally water vapour and carbon dioxide, too much heat would be carried away, reducing earth’s average temperature by 20 degrees Celsius.
Circled in black is the small amount of infrared radiation trapped by the greenhouse gases.
To understand infra-red radiation, we need to understand the electromagnetic spectrum.
Radiation of various types is all around us, from radio waves to visible light to microwave radiation. Radiation travels outwards from its source in a series of waves, something like the waves you see when you throw a stone into still water.
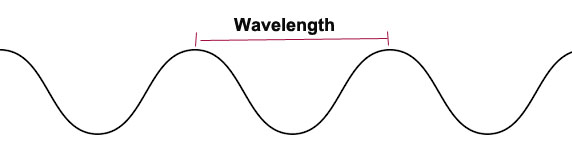 The distance between wave crests is called the wavelength. The number of waves that pass a fixed point in one second is called the frequency. In electromagnetic waves, the frequency is given cycles per second, or hertz. In the visible and infrared parts of the spectrum, the frequency is in millions of hertz (megahertz), or billions of hertz (gigahertz).
The electromagnetic spectrum
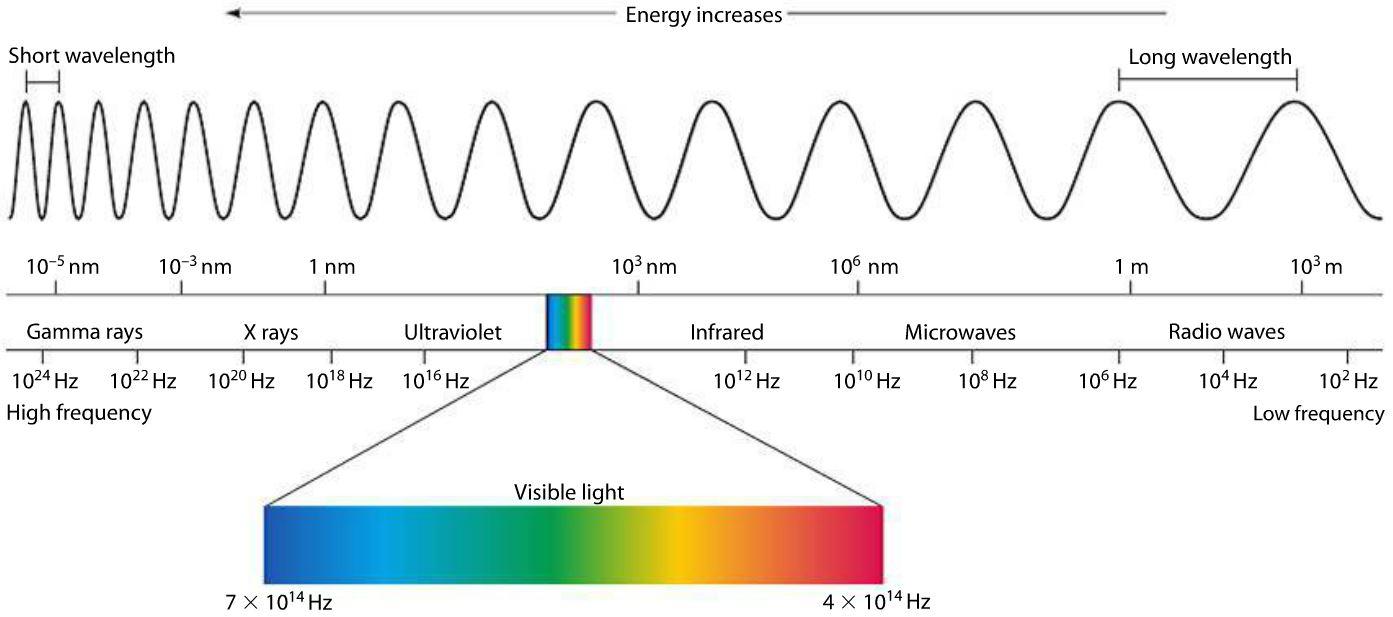 We need to look at something scientists call earth’s spectral emissions. This is the amount of heat given off into space from the earth in the form of infra-red radiation in the absence of the so-called greenhouse gases, including water vapour and CO2. You will note the heat given off is mostly in a relatively small band of wavelengths between five micro-metres and twenty micro-metres, where one micrometre is one millionth of a metre.
That band, in turn, is just a minute amount of the electromagnetic spectrum.
Without the influence of the greenhouse gases, too much heat would escape into space, lowering the earth’s average temperature by around 20 degrees Celsius. At this temperature, most of the planet would be covered in an ice sheet making the planet uninhabitable.
This is where that great little molecule, carbon dioxide and the other greenhouse gases come into play by absorbing some of the escaping heat.
The graph below is by Dr. W. Happer, Cyrus Fogg Brackett Professor of Physics, Emeritus, at Princeton University, and former science advisor to the president of the United States on the National Security Council. The graph was included in a speech he gave at Hillsdale College in Phoenix Arizona on February 19, 2021.[I]
(You can read the transcript of the speech here)
The top blue curve is the theoretical heat loss from the Earth into the vacuum of space for the range of frequencies, assuming no atmosphere. This is known as Planck’s curve for heat loss from the Earth. (Notations above the curves are of various chemical compounds at their spectral frequencies.)
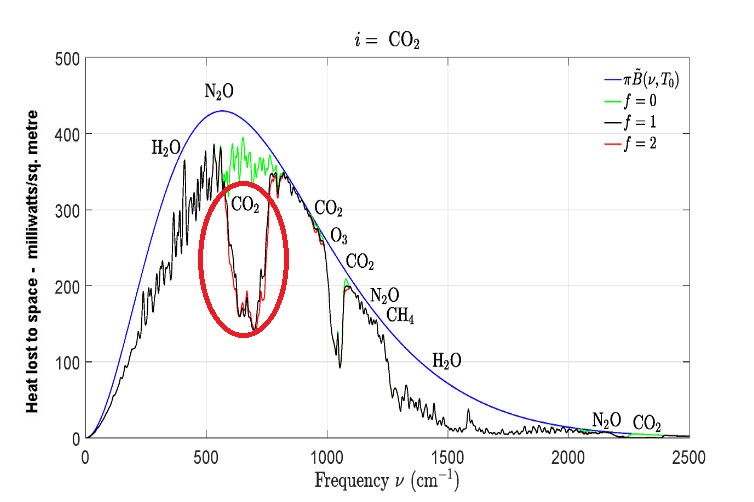 The sawtooth curve shows the actual heat loss through the Earth’s atmosphere for each frequency, where the percentages of CO2 are 0 ppm, (in green), 400 ppm (in black) and 800 ppm (in red). The sawtooth curve is known as the Schwarzschild curve. It was calculated mathematically by German scientist, Karl Schwarzchild (1873 – 1916).
In recent times the curve has been modified and made more accurate by reference to a large scientific database known as HITRAN. This database is a summary of thousands of interactions between electromagnetic radiation and dozens of atoms and molecules, including the greenhouse gas molecules.
In a scientific paper[ii], Professor Happer has calculated the curve for CO2 at 400 ppm and at 800 ppm. The above chart is referenced as figure 4 in Professor Happer’s paper. He refers to it in an email to me below.
Recent satellite observations validate the mathematics of this curve. (The heat loss for all other compounds are for conditions as they exist today.)
Of particular importance are the circled, red and black, CO2 curves. The black curve is for CO2 at 400 ppm and the red curve is for CO2 at 800 ppm.
These two curves, highlighted by the circle, are virtually the same, indicating that heat loss is nearly unchanged after doubling CO2 from 400 to 800 ppm.
In other words, adding CO2 to the atmosphere so that atmospheric levels of CO2 doubles (from 400 ppm to 800 ppm) has virtually no effect on temperatures.
CO2 is saturated, and adding more CO2 to the atmosphere has a minimal effect.
Note that heat loss from the Earth would have been greater if atmospheric CO2 was at 0 ppm, as shown by the green curve.
Dr Happer is a highly-credentialed physicist. He is the author of more than 200 peer-reviewed scientific papers. However, his paper is going to turn the climate change discussion on its head, so I searched for other scientific papers relating to this phenomenon.
I located a scientific paper titled “Narrow Band Schwarzchild Radiation Balance Equations – A Simple Accurate Climate Model, with references in the endnotes”.[iii]
You can read the paper if you are if you have a lazy afternoon and a passion for advanced maths.
The summary of the paper states (my emphasis):
“The radiation balance equations of K Schwarzschild describe how heat absorbing gasses in the atmosphere of a planet will warm the planet by trapping the heat re-radiated from the surface of the planet. The original theory proposed back in 1906 grossly overestimates the amount of warming. However a simple modification3 where the heat absorption is limited to a narrow band of radiation frequencies greatly improves the accuracy of the theory.
The first section of this derives the Schwarzschild equations in detail. Next they are modified for a narrow absorption bands; finally the modified equations are applied to the atmospheres of Mars and Earth. The calculations show a 25% increase of CO2 in the atmosphere of Earth will produce a surface temperature increase of about a tenth degree Celsius.”
This is an amazing piece of science that flies in the face of the “science is settled” mantra of the climate zealots.
In an email to me, Professor Happer said:
“You might also like to look at Fig. 15 of the arXiv paper, where we compare our model calculations with satellite observations. You can hardly notice the difference between models and observations. I don’t think there is any doubt that Fig. 4 is rock-solid physics.”
So the trillions of dollars being spent on mitigating climate change is wasted. Based on this science, the planet is in no danger of overheating. On the other hand, most Western economies are in danger of being devastated.
Meanwhile China happily continues building dozens of new coal-fired power stations, using its cheap electricity to manufacture goods cheaper than competitors in the Western world. It utilises the hundreds of billions of dollars profit from this unfair trading practice to buy up assets around the world as well as building up an already menacing military presence.
The Chinese Communist Party (CCP) must be laughing all the way to the bank.
[i] https://www.youtube.com/watch?v=CA1zUW4uOSw&list=PLPb1oLZ9qHJN3sT_ZsYGKDsu6axh5bOrE
[ii] https://arxiv.org/pdf/2006.03098.pdf

Very interesting article, thanks for sharing your thoughts on this.